
Contents
- Start with the right holding benchmark
- Follow one full-range, 50:50 pool
- Use the price ratio, not a single token's cash price
- Add fees and rewards, then subtract costs once
- Know where this formula stops working
- Does waiting make the loss disappear?
- Compare your two choices in five steps
- Common questions about impermanent loss and holding
- Sources and scope
Impermanent loss measures how a liquidity position falls behind simply holding the tokens you originally deposited, before fees. It does not necessarily mean your position is worth less than when you started. A position can rise in value and still leave you with less than holding would have.
To make the comparison, use the original token quantities, value both choices at the same later prices, then account for income and costs once. The example below shows why those three steps matter.
Start with the right holding benchmark
Suppose you have 1 token A and 1,000 tokens B. At the start, 1 A is worth 1,000 B, so your basket is worth 2,000 B.
You can either put that basket into a liquidity pool or hold exactly those quantities outside it. If you choose to hold, the benchmark remains 1 A plus 1,000 B. It does not become a basket that you continually rebalance, and it does not stay fixed at its starting value of 2,000 B.
At a later price of 2,000 B per A, holding is worth:
1 A × 2,000 B per A + 1,000 B = 3,000 B.
That 3,000 B is the comparison value, not the original 2,000 B. Uniswap's v2 return explanation uses the same original-token holding comparison.
Two questions now have different answers:
- Did my position gain or lose value? Compare its ending value with its starting value, in the same unit.
- Did providing liquidity beat holding? Compare its ending value, including the appropriate income and costs, with the original basket at the same ending prices.
Here, B is just the unit in which values are measured. Neither A nor B is a real token, and B is not assumed to be a stablecoin or worth one dollar. A gain measured in B need not be a gain in your home currency.
Follow one full-range, 50:50 pool
For this hypothetical example, assume a full-range, 50:50 constant-product liquidity-provider (LP) position with no fees. Full-range means liquidity is available across all positive prices, rather than a chosen band. At entry, A and B each supply half its value. The position follows x × y = k, where x is its A quantity and y is its B quantity. Assume trading has brought the pool price into line with the stated outside price. There are no fees, rewards, costs, deposits, withdrawals or rebasing tokens. Only trades change the token quantities.
For our starting quantities, k = 1 × 1,000 = 1,000. If the price of A is P B per A, the model requires y / x = P. Solving the two equations gives:
- A quantity: x = √(1,000 / P).
- B quantity: y = √(1,000 × P).
- Position value in B: x × P + y.
This is the reserve arithmetic described in Uniswap's v2 documentation, applied to our own fictional inputs. It is not a universal calculator for every liquidity pool.
What changes when A doubles or halves?
Each row below is a separate outcome from the same start, not the next step in a trading sequence. Displayed quantities are rounded to six decimals, values to two decimals and percentages to two decimals. Calculations use unrounded numbers.
| Outcome | Price of A, in B | A in the LP position | B in the LP position | LP value, in B | Original basket held, in B |
|---|---|---|---|---|---|
| Starting point | 1,000 | 1.000000 | 1,000.000000 | 2,000.00 | 2,000.00 |
| A doubles | 2,000 | 0.707107 | 1,414.213562 | 2,828.43 | 3,000.00 |
| A halves | 500 | 1.414214 | 707.106781 | 1,414.21 | 1,500.00 |
When A rises, the position holds less A and more B. When A falls, it holds more A and less B. You are not keeping the original token quantities while separately collecting trading income.
| Outcome | LP return from the 2,000 B start | Holding return from the same start | LP shortfall versus holding | Shortfall as a share of holding |
|---|---|---|---|---|
| Starting point | 0.00% | 0.00% | 0.00 B | 0.00% |
| A doubles | +41.42% | +50.00% | 171.57 B | 5.72% |
| A halves | −29.29% | −25.00% | 85.79 B | 5.72% |
In the price-up case, the LP position gains 828.43 B. It nevertheless finishes 171.57 B behind holding. Calling that a 5.72% loss of your original deposit would be wrong: the percentage uses the 3,000 B holding value as its denominator.
The two price outcomes have the same percentage shortfall but different shortfalls in B. They also have different absolute returns. Neither the 5.72% figure nor the word “loss” tells you the whole result.
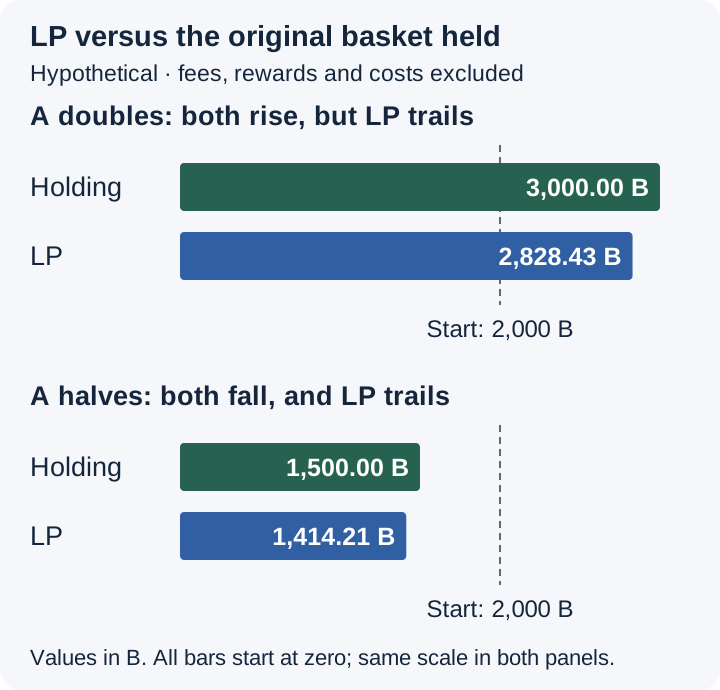
The dashed line marks the same 2,000 B starting value in both panels. Solid bars show holding and the fee-excluded LP position at the same later price. All values and assumptions appear in the tables above; the diagram is not a record of market performance.
Use the price ratio, not a single token's cash price
Let r be the final price of A in B divided by its starting price in B. For this full-range 50:50 model, the signed relative difference is:
LP value / holding value − 1 = 2√r / (1 + r) − 1.
For r = 2, the result is approximately −0.057191, or −5.72%. For r = 0.5, it is the same. The tables express this as a positive 5.72% shortfall; the equation expresses it as a negative −5.72% relative return. These are two sign conventions for the same comparison.
You can check the equation directly from the example. At price P = 1,000r, the LP value is 2,000√r B and holding is 1,000(1 + r) B. Dividing one by the other gives 2√r / (1 + r).
The ratio also explains a useful limit. If A and B both double in dollar price, their price relative to each other is unchanged. In this idealized model, r remains 1 and the shortfall versus holding is zero, even though both baskets have doubled in dollar value. If both halve in dollar price while keeping the same ratio, the shortfall is also zero, but both baskets have lost half their dollar value.
Zero impermanent loss therefore does not mean zero investment risk or zero loss in cash terms. This equation measures one comparison, not every way a position can lose money.
Add fees and rewards, then subtract costs once
Fee income can compensate for the shortfall, but a quoted yield does not establish that it will. You need the income actually earned over the comparison period, valued consistently with the position, and the costs of earning or collecting it.
For a real position, calculate:
Net LP outcome = current position value + income not already included − costs not already deducted.
Compare that with the original holding basket, adjusted for any income or costs applicable to that alternative. Use the same ending time and valuation currency. If the alternative earns yield or is actively rebalanced, name that strategy rather than calling it simple holding.
A separate income ledger
Now add hypothetical income and costs to the price-up example. Assume the principal remains the calculated 2,828.427125 B and the following income is held separately, not reinvested or already counted in that principal. All amounts are valued in B at the comparison time. Holding has no income or costs in this illustration.
| Component | Amount, in B | Treatment |
|---|---|---|
| Fee-excluded principal value | 2,828.43 | Count once |
| Separately earned trading fees | +200.00 | Add only because they are outside the principal value |
| Separately earned rewards | +50.00 | Add their ending value, not an advertised annual rate |
| LP costs paid separately | −30.00 | Subtract once |
| Net LP outcome | 3,048.43 | Principal + fees + rewards − costs |
| Original basket held | 3,000.00 | Same ending price |
| Net difference versus holding | +48.43 | About +1.61% of the holding value |
The 220 B of net income exceeds the 171.57 B shortfall versus holding. That is why the net LP outcome beats holding here. Without the 50 B reward, the same ledger would end at 2,998.43 B, slightly below holding despite 200 B of fees.
With 30 B of extra costs and no rewards, fee income would need to reach approximately 201.572875 B to match holding. The threshold is the unrounded shortfall plus those costs, not “5.72% APY.” No duration or future earning rate is assumed.
Do not subtract impermanent loss again from the actual position value: its changed token quantities already reflect the divergence. Likewise, do not add an “earned fees” dashboard figure if those fees are already inside the displayed position balance. If fees were reinvested, use the actual resulting balances instead of assuming they can simply be added to the fee-free example.
Relevant costs can include network transactions to enter, manage and exit, swaps needed to obtain the starting basket, execution costs and any separately charged service fee. Check what a quote or balance already includes before adding another cost. Taxes are outside this illustration and depend on the applicable rules.
Know where this formula stops working
Concentrated liquidity needs the position's range
A concentrated-liquidity position is not just the full-range example with a larger fee rate. Its lower and upper price bounds affect its token quantities. When the price leaves a standard Uniswap v3 or v4 position's range, its active liquidity stops earning swap fees and its principal is held in one token. Re-entering the range can reactivate it; that does not promise a recovery of value. See Uniswap's concentrated-liquidity explanation.
To compare one with holding, obtain the actual range, current token quantities, uncollected fees and any changes made along the way. A calculator that asks only for the two tokens' price change is not enough for an arbitrary concentrated position. Uncollected fees may also sit separately from the one-token principal.
Different pool designs need different mathematics
The 50:50 equation does not automatically apply to weighted pools or stable-swap pools. Different weights or a different reserve rule change the calculation. Curve, for example, documents a StableSwap invariant designed for assets expected to trade close to one another, rather than the simple x × y constant used here.
The benchmark still makes sense: compare with the same original quantities at the same ending prices. It is the method for calculating the pool position that must change.
A stablecoin pair is not risk-free
Two assets maintaining a close price ratio may show little divergence. That does not guarantee either asset will maintain its peg. A depeg can leave a pool heavily exposed to the weaker asset, which may not recover. Curve's liquidity-pool risk disclosure explains that risk.
There are also risks the impermanent-loss formula does not model, including smart-contract failures and problems with the tokens themselves. Uniswap's liquidity risk guide describes these separately. A small modeled shortfall is not a safety rating.
Does waiting make the loss disappear?
Not necessarily. In the unchanged fee-free model, a return to the original A/B price ratio makes the shortfall versus holding zero. That is a conditional arithmetic result, not a forecast that the ratio will return.
The relative shortfall is measurable before withdrawal. Leaving a position open does not erase it, guarantee recovery or protect the token's cash value. Uniswap's impermanent-loss explanation explicitly notes that the price may or may not return.
If you change the range, rebalance, add funds or withdraw part of the position, track those actions rather than treating the position as the unchanged starting example. A later calculation needs those cash flows and any associated costs.
Compare your two choices in five steps
- Write down the starting basket. Record quantities, entry prices and the comparison period. Keep original-basket holding separate from holding only A or continually rebalancing.
- Identify the pool's actual design. Check its invariant, weights, ranges and how it accounts for fees. Use a position-specific calculation when the simple assumptions do not fit.
- Value both alternatives at the same ending time. Use matching prices and a common unit. Distinguish an estimated value at current prices from a quote for what you could receive by exiting.
- Reconcile income and costs. Include each amount once, and allow for the costs and income of both alternatives. If you are comparing cash you could withdraw, use a consistent exit method for each.
- Read the two answers separately. Report the gain or loss from the start, then the difference versus holding. Neither answer removes token, contract or execution risks.
The useful question is not just “How much impermanent loss do I have?” It is “After income and costs, what do I have compared with the alternative I intended to use?”
Common questions about impermanent loss and holding
Can I make a profit and still have impermanent loss?
Yes. In the price-up example, the fee-excluded LP value rises from 2,000 B to 2,828.43 B, yet holding the original basket would be worth 3,000 B. The LP position gains value but underperforms that benchmark.
Is a 5.72% shortfall the same as losing 5.72% of my deposit?
No. It is 5.72% of the ending holding value in these examples. A return from your initial deposit uses a different denominator. Always check what the percentage is relative to.
Do higher fees guarantee that liquidity provision wins?
No. What matters is the fee income actually earned, other income, all relevant costs and the position's value over the same period. A quoted APR or APY is not cash already earned and cannot be compared directly with this shortfall percentage: the time period and calculation base also need to match.
Is holding immune to losses?
No. Holding keeps the original quantities, not their original value. Both tokens can lose value in your reporting currency, even when their price ratio stays unchanged and this model shows no divergence shortfall.
Does withdrawing cause the relative shortfall?
No. You can compare the position with holding while it remains open. Withdrawal changes what you hold and can incur costs, but it is not the event that makes the existing relative underperformance measurable.
Keep learning
Explore educational guides. These links do not open trading markets.
Sources and scope
- Uniswap v2: Understanding Returns: the fee-excluded constant-product model and original-basket comparison.
- Uniswap: Concentrated Liquidity: range-specific positions and active liquidity.
- Uniswap Labs: What Is Impermanent Loss?: no guarantee that a price returns; updated February 10, 2025.
- Uniswap Labs: Risks When Providing Liquidity: token, contract, range-management and network-cost risks.
- Curve: Understanding StableSwap and Liquidity Pools Risk Disclaimer: a different invariant and the risk of a lasting depeg.
Source passages were checked on October 22, 2026. All A/B inputs, outcomes, fees, rewards and costs are hypothetical. Values are not live prices, quoted yields or executable withdrawal amounts. This is an educational comparison, not a recommendation to use a particular pool.
HypaForecast publishes educational guides and operates a prediction market. This illustration does not establish a HypaForecast liquidity-provision product.
Share this guide