
Contents
- First check the date, geography and unit
- The columns answer different questions
- How the current five-year comparison works
- A worked example: stock, weekly change and seasonal gap
- Why net change and implied flow can differ
- The historical band is not a safety margin
- Why “above average” is not a price forecast
- A five-line note for the next report
- Sources
The five-year average in the U.S. Energy Information Administration's Weekly Natural Gas Storage Report is a seasonal reference for how much working gas is in storage. It is not an analyst forecast for this week's injection, a measure of total storage capacity or a stand-alone prediction of natural gas prices.
Start by separating the stock from the change. “Gas in storage” is a level at a specified date. A weekly net change is the difference between two stock estimates. The gap against the five-year average compares the current level with a historical seasonal reference. Those numbers can all be positive and still tell you different things. EIA report, methodology
First check the date, geography and unit
The report estimates working natural gas in underground storage for the Lower 48 U.S. states and its reporting regions. “Working gas” is distinguished from base gas, which supports storage operations. Do not read the working-gas headline as all gas physically present underground, all energy inventories or worldwide storage. EIA methodology
Storage amounts are reported in Bcf, or billion cubic feet. This is a volume, not a price or an energy-price unit. A change measured over a week can also be expressed in Bcf without becoming Bcf per day. Keep the period attached to it.
Use the data's “as of” date rather than the date on which you happen to open the page. The report is released after the storage observation period, so the headline figure does not describe a continuous live inventory reading. The source's date and units belong in any chart or note you make. Weekly report columns
The columns answer different questions
| Measure | Question it answers | What it does not mean |
|---|---|---|
| Working gas stock | How much working gas is estimated to be stored at the observation date? | How much gas entered storage that week. |
| Weekly net change | How much did the reported working-gas stock change from the previous week? | Necessarily the same as physical net flow when a reportable reclassification occurs. |
| Implied flow | What is the net change after excluding reportable base/working-gas reclassifications? | A direct measurement of every injection and withdrawal. |
| Year-ago comparison | How does the stock compare with the aligned date one year earlier? | A comparison with any old release that happens to have a similar week number. |
| Five-year stock average | How does the stock compare with the same-season reference across five prior years? | The expected injection this week or the capacity ceiling. |
| Five-year minimum/maximum band | What range do the aligned historical stock observations span? | A confidence interval or a physical limit. |
EIA explains net change and implied flow in its report notes and sets out the comparison method separately. For a release with an adjustment, read the note rather than treating every stock change as a new physical injection or withdrawal. Notes and definitions, methodology
How the current five-year comparison works
EIA's current method first estimates daily inventory levels by linearly interpolating between historical weekly observations. It then compares matching calendar dates across the preceding five years. The arithmetic mean of those aligned daily estimates becomes the five-year average for the date in question. The historical minimum and maximum use the same daily-alignment approach. EIA's current comparison method
“Daily interpolation” does not mean EIA had a direct survey observation for every historical day. It means the method estimates values between reported weeks so that the seasonal comparison is aligned by date.
A small invented example shows the idea. Suppose a historical stock estimate is 2,800 Bcf on one weekly observation date and 2,870 Bcf seven days later. Linear interpolation assigns a change of 10 Bcf per day between them. Three days after the first observation, the interpolated estimate is 2,830 Bcf. It is an estimate along that line, not proof that exactly 10 Bcf entered storage on each of those days.
This also explains why the report's year-ago comparison may not match the number in a prior-year Friday release. It refers to the matching calendar date, which can fall between historical observation dates.
Why an older explanation can be misleading
The methodology page also describes a previous approach: a simple average of recorded stocks in corresponding numbered weeks. That section is explicitly about estimates from May 2002 through December 2004. The current daily-interpolated method began with the week ended January 7, 2005. Reading the historical section without its heading can lead to an incorrect description of today's calculation. EIA methodology: current and historical methods
The practical rule is simple: use the benchmark EIA publishes for the relevant observation date and reference period. Do not reconstruct it by averaging five consecutive weeks, five annual averages or five unadjusted “week 40” values.
A worked example: stock, weekly change and seasonal gap
All numbers in this example are fictional. They are chosen to show the arithmetic, not to describe a current release.
Assume the following five historical stock estimates have already been aligned to the same calendar date in five prior years:
| Reference year | Aligned stock, Bcf |
|---|---|
| Year 1 | 2,850 |
| Year 2 | 2,900 |
| Year 3 | 2,950 |
| Year 4 | 3,000 |
| Year 5 | 3,050 |
| Five-year mean | 2,950 |
Now suppose the current stock is 3,000 Bcf and the previous week's stock was 2,920 Bcf.
| Calculation | Result | Interpretation |
|---|---|---|
| 3,000 − 2,920 | +80 Bcf | Weekly net increase in the stock. |
| 3,000 − 2,950 | +50 Bcf | Current stock above the five-year mean. |
| 50 ÷ 2,950 × 100 | About 1.69% | Stock surplus as a percentage of that mean. |
| Lowest to highest historical input | 2,850–3,050 Bcf | Five-year range for this fictional aligned-date example. |
The current stock is above the average but still inside the historical range. The +50 Bcf surplus is not the +80 Bcf weekly increase. Neither figure means that storage is “50 Bcf from full.” Capacity requires a separate measure.
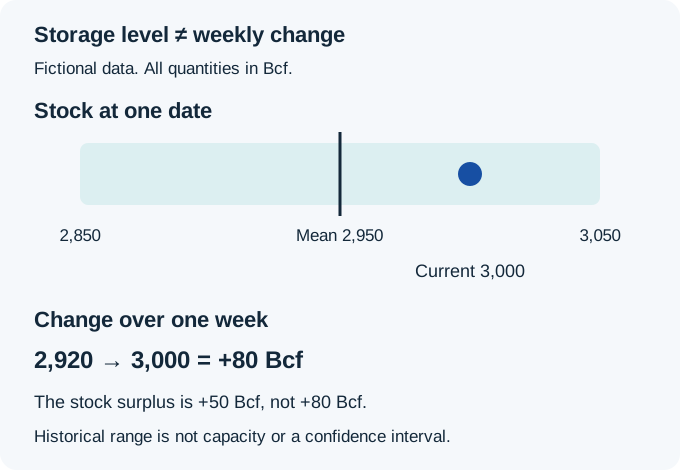
Figure: Fictional teaching data. Stock levels and weekly changes are shown in separate panels because they answer different questions.
Compare weekly flow with a weekly reference
Suppose a separately supplied, comparable historical weekly-flow reference is +65 Bcf. With no reclassification in this scenario, the +80 Bcf weekly increase is 15 Bcf above that reference.
This +65 Bcf input is assigned for the example. It is neither an analyst consensus nor calculated from the five stock levels above. A historical reference and a market expectation are different comparisons, even if both happen to be described as an “average.”
EIA's storage dashboard includes separate comparisons for weekly net inventory changes and explains that their methodology was modified in November 2018. Do not assume that an explanation of the stock benchmark completely specifies the dashboard's weekly-change calculation. EIA dashboard notes
Why net change and implied flow can differ
Now change one assumption in the same fictional week. Suppose operators reclassify 5 Bcf from base gas to working gas, and that is the only adjustment.
The stock still rises by 80 Bcf, but 5 Bcf of that increase reflects classification rather than additional gas flowing into storage. Implied flow would be +75 Bcf:
80 Bcf net change − 5 Bcf base-to-working reclassification = 75 Bcf implied flow.
A reclassification in the opposite direction would need the opposite adjustment. Do not subtract an adjustment mechanically without checking its sign and the report note. EIA states that implied flow excludes reportable reclassifications; the published methodology specifies a 4 Bcf reporting threshold for the reclassification adjustment described there. EIA methodology, reclassifications
That distinction matters when describing the data. “Stocks rose by 80 Bcf” and “75 Bcf of implied net flow” can both be correct in this example. Calling the entire 80 Bcf a physical net injection would discard the adjustment.
The historical band is not a safety margin
A five-year range summarizes a small historical window. It does not tell you the probability of future stocks falling outside the band. Nor does its maximum represent all physically usable storage capacity.
The benchmark also moves when the reference years change. A surplus relative to one five-year window is not automatically comparable with a surplus relative to another window. Record the period printed beside the average, particularly when comparing releases across calendar years.
For regional analysis, use the relevant region's published comparison. EIA calculates regional historical minima and maxima independently, so their sum need not equal the Lower 48 minimum or maximum: different regions can reach their extremes in different reference years. EIA methodology
Storage is estimated from survey data and is subject to statistical and reporting limitations. Independently rounded figures may not add exactly, and later revisions can change earlier comparisons. Before interpreting a very small difference, check the sampling-variability information, rounding and any revision note. A displayed one-unit difference is not automatically a meaningful change in the underlying market.
Why “above average” is not a price forecast
A historical stock surplus is useful context, but it does not tell you what traders expected before the release or how supply and demand will develop afterward.
For example, an injection can be larger than a seasonal reference and still smaller than an explicitly sourced market forecast. These are different statements. Without a verified forecast, you cannot label the release an upside or downside surprise relative to consensus.
Further context includes weather and temperature forecasts, production, power-sector demand, exports and regional constraints. EIA's dashboard places storage alongside several of these measures for a reason: the same stock level can have different implications under different demand, supply and seasonal conditions. EIA dashboard explanations
The report also looks backward at an observation period, while prices incorporate expectations about what comes next. A price move around publication does not by itself prove that one storage number caused it. Storage data can inform an assessment without supplying a universal buy or sell rule.
A five-line note for the next report
Before drawing a conclusion, write down:
- The observation date, geography and Bcf unit.
- The stock level and weekly net change, separately.
- Any difference between net change and implied flow.
- The stock's year-ago and five-year comparisons, with the reference period.
- Any separately sourced expectation, revision or supply-demand context needed for the claim you want to make.
That note prevents the most common mistake: treating a stock surplus, a weekly injection and a surprise against expectations as if they were the same number.
Continue learning
Choose another explanation for the question you want to check next.
Sources
- EIA Weekly Natural Gas Storage Report: report structure, observation dates and units. No current release figures are reproduced here.
- EIA methodology: daily-interpolated stock comparisons, historical method, reclassifications, survey estimation and rounding.
- EIA notes and definitions: stock and flow terminology.
- EIA Natural Gas Storage Dashboard notes: separate stock and weekly-change displays, capacity and supply-demand context.
HypaForecast publishes educational guides and operates a prediction market. This page is an educational explanation.
Share this guide