
On this page
- Read the units before comparing the numbers
- A forecast card has more than one answer
- Can a higher chance of rain mean a smaller amount?
- Amount and intensity need different clocks
- Keep the location and forecast period attached
- Turn “will it rain?” into a precise question
- Frequently asked questions
- Choose what to read next
A 40% chance of rain describes how likely a defined rain event is, not how much rain will fall. In the US National Weather Service (NWS) definition, it means a 40% chance of at least 0.01 inch at the forecast point during the stated period. It does not mean rain for 40% of the day. NWS Peachtree City explanation
To read a forecast, keep three questions separate: will measurable precipitation occur, how much could accumulate, and where and when does the forecast apply? The percentage answers the first question. You need the other forecast fields to answer the rest.
Read the units before comparing the numbers
| Forecast field | What it describes | What it does not tell you by itself |
|---|---|---|
| Probability, such as 40% | Chance of reaching the provider's measurable-precipitation threshold | Rainfall total or hours of rain |
| Amount, such as 0.20 inch | Accumulated depth over a stated period | The probability of that total |
| Rate, such as 0.10 inch per hour | Depth per unit of time | The total unless you also know how long that rate lasts |
| Location and period | The point or area, start and end time to which a value applies | Conditions at every nearby location or every moment |
Percent, inches and inches per hour are different kinds of measurements. Compare percentages with percentages for the same event definition, and amounts with amounts for the same location and period. A bigger number in one column does not necessarily imply a bigger number in another.
The NWS Albany fact sheet explicitly separates precipitation probability from intensity, duration and area coverage. Its definition covers liquid precipitation or the water equivalent of frozen precipitation. A percentage labeled precipitation therefore needs the forecast's precipitation type alongside it; it does not by itself specify rain rather than snow. NWS Albany fact sheet
A forecast card has more than one answer
The following diagram is an invented teaching example, not a forecast or a screenshot from an app. Its amount field is explicitly conditional: the range describes the amount if the defined rain event occurs. Do not assume that an amount displayed by a real provider has this same meaning.
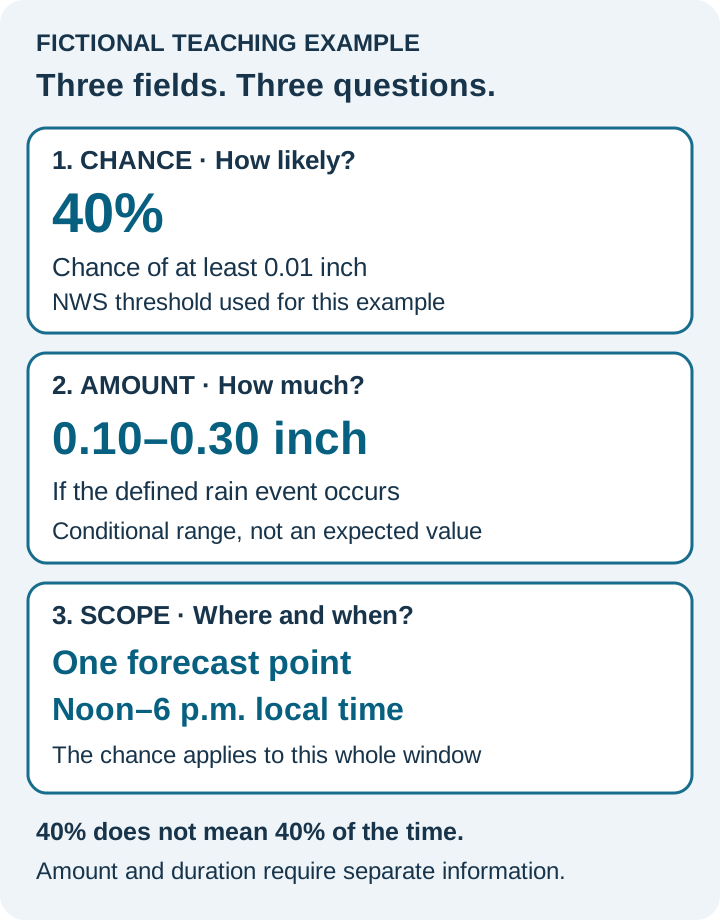
Here, 40% belongs to the event “at least 0.01 inch at this point between noon and 6 p.m.” The range belongs to a different statement about how much might accumulate if that event occurs. Neither field says when within those six hours the rain begins or how long it lasts.
The 0.01-inch threshold comes from the NWS definition used in this example. When reading another weather service or app, check its own definition, units and period instead of transferring the NWS threshold automatically. NWS Paducah educational guide
Can a higher chance of rain mean a smaller amount?
Yes. Consider two fictional forecasts for the same point and six-hour period. The conditional amounts below are teaching assumptions, not observations or real forecasts.
| Fictional forecast | Chance of at least 0.01 inch | Amount if that event occurs |
|---|---|---|
| A | 80% | 0.02–0.05 inch |
| B | 30% | 0.50–1.00 inch |
A makes measurable rain more likely. B describes a larger amount if its rain event occurs. There is no contradiction: likelihood and quantity answer different questions.
The numbers do not tell you the exact expected rainfall. In particular, multiplying B's 30% by the upper endpoint of 1.00 inch would treat the upper endpoint as though it represented every wet outcome. It does not. A range alone does not say how probability is distributed across its values, and the example does not specify amounts below the measurable threshold.
Before doing arithmetic with a real forecast's amount field, find out what that number represents. A conditional range, an average over possible outcomes and a probability of exceeding a stated amount would require different interpretations. Do not turn an unlabeled amount into an expected value.
Amount and intensity need different clocks
An accumulated total does not reveal how quickly it arrived. Imagine two deliberately simplified cases, each with exactly 0.30 inch of rain:
- Case one: all 0.30 inch falls at a constant rate over 30 minutes. Because 30 minutes is 0.5 hour, the rate is 0.30 ÷ 0.5 = 0.60 inch per hour.
- Case two: all 0.30 inch falls at a constant rate over six hours. The rate is 0.30 ÷ 6 = 0.05 inch per hour.
The first rate is 12 times the second, although the totals match. These examples assume constant rates to make the arithmetic transparent. With a changing rate, dividing total rain by elapsed time gives an average over that interval, not the peak rate.
Nothing in a 40% precipitation probability selects either of these rainfall patterns. To understand timing and intensity, read the forecast information that describes those features rather than trying to extract them from the percentage. This is an explanation of forecast quantities, not an assessment of weather hazards.
Keep the location and forecast period attached
A percentage belongs to a specified place and time interval. The NWS Louisville explanation emphasizes the forecast point and period; its local examples commonly use 12-hour periods. Albany's fact sheet describes periods ranging from one to 12 hours. Those examples are a reason to read the displayed interval, not a reason to assume every daily or hourly forecast uses the same window. NWS Louisville explanation, NWS Albany fact sheet
Suppose a fictional forecast gives 40% for noon to 6 p.m., and your question concerns 2 to 3 p.m. The six-hour number alone does not tell you the probability for that one-hour interval. Dividing 40% by six would silently assume a relationship between the hourly events that the forecast has not supplied.
Likewise, two successive hourly percentages cannot simply be added to obtain the period's chance of rain. Rain in adjacent hours can overlap as part of the same event. You would need information about how those events relate, or a probability supplied for the whole period.
A forecast for a city also should not be read as a promise about every address nearby. Check the selected forecast point, not just the city name shown in a search result. When comparing two providers, align their location, valid period and update time before treating different percentages as competing answers to the same question.
Why the “percent of the area” explanation is incomplete
NWS Paducah illustrates a forecasting calculation using confidence that precipitation develops and expected area coverage. That does not make the published probability a simple map showing what fraction of an area will get rain. The same guide states that the result is a probability for a given point and rejects reading 40% as either area coverage or time spent raining. NWS Paducah educational guide
For a reader, the important output is the defined event at the selected location. You cannot recover a unique coverage pattern or confidence component from the published percentage alone.
Turn “will it rain?” into a precise question
A useful way to compare forecast statements is to write down their boundaries:
- Threshold: any detectable rain, at least 0.01 inch, or a larger accumulation?
- Location: a forecast point, a named observation station, or an area?
- Window: what start time, end time and time zone apply?
- Result source: which observation record would answer the question afterward?
Consider an invented statement: “Station A records at least 0.50 inch between noon and 6 p.m. local time.” A forecast for at least 0.01 inch at a nearby grid point concerns a different threshold and potentially a different location. Its percentage cannot be relabeled as the probability of that station-level 0.50-inch outcome.
If you encounter a weather-related event contract, compare its actual wording with the forecast before using one to interpret the other. The named observation source and outcome rules matter as well as the weather estimate. This is an event-definition example, not a claim that HypaForecast offers weather markets.
Frequently asked questions
Does a 40% chance of rain mean it will rain for 40% of the day?
No. In the NWS definition, it is the probability of measurable precipitation at a point during the stated forecast period. The percentage does not specify the duration of rain within that period. NWS Peachtree City explanation
Does an 80% chance of rain mean heavy rain?
No. A high probability indicates greater likelihood of the defined precipitation event, not greater intensity. Read the amount and timing information separately. NWS Albany fact sheet
How much rain counts as measurable precipitation?
The NWS definition used here is at least 0.01 inch of liquid precipitation, including the water equivalent of frozen precipitation. This is a named-provider definition, not a claim about every app or national weather service. NWS Binghamton forecast terms
Does 100% chance of rain mean rain all day?
No. It describes the chance of the defined event within the period, not continuous precipitation throughout it. Albany's fact sheet explicitly notes that a 100% probability does not specify how long precipitation lasts. NWS Albany fact sheet
Can I multiply the chance of rain by the rainfall amount?
Not without knowing what the amount represents and the assumptions behind the calculation. A range endpoint is not the average amount conditional on rain, and a displayed amount may already incorporate uncertainty. The fictional forecast comparison above deliberately leaves expected rainfall unspecified.
Choose what to read next
If your question is how probabilities combine with numerical outcomes, continue with expected value and probability. If you want to understand which event and evidence determine a contract's result, read prediction-market resolution rules.
For the forecast itself, keep the percentage, amount and location/time window together. Each supplies a different part of the answer.
Share this guide