
Contango means later delivery is priced above earlier delivery along the part of a futures curve you are comparing. Backwardation is the reverse. Compare contracts for the same underlying at the same observation time, and name the expiries. These labels describe a price relationship today, not a guaranteed path for the spot price tomorrow. [2][5]
You will also see the terms used to compare a futures price with today's spot price. State which comparison you mean: futures versus spot, or one futures expiry versus another. A higher December price than a November price does not, by itself, tell you where either sits relative to spot. [1][5]
The difference at a glance
| Question | Contango | Backwardation |
|---|---|---|
| Near versus far futures, at one observation time | Far contract is higher | Far contract is lower |
| Futures versus current spot, when that is the stated comparison | Futures is above spot | Futures is below spot |
| What the label establishes | The sign of the specified price difference | The sign of the specified price difference |
| What it does not establish | A certain rise in future spot prices | A certain fall in future spot prices |
The table separates the two uses of these terms. [1][5]
A curve can change direction between maturities. Describe the segment rather than forcing every contract into one label. Nor should a curve joining different expiries be confused with a time-series chart following one contract through successive days.
A synchronized, same-underlying example
Consider two alternative fictional snapshots of the same commodity, quoted in USD per unit. Within each snapshot, the spot reference and both futures prices are observed at the same time and assumed comparable in grade, location and units. These are not market quotes.
| Snapshot | Current spot reference | Near futures: one month | Far futures: three months | Far minus near |
|---|---|---|---|---|
| A: upward-sloping | $100 | $102 | $106 | +$4 per unit |
| B: downward-sloping | $100 | $98 | $95 | −$3 per unit |
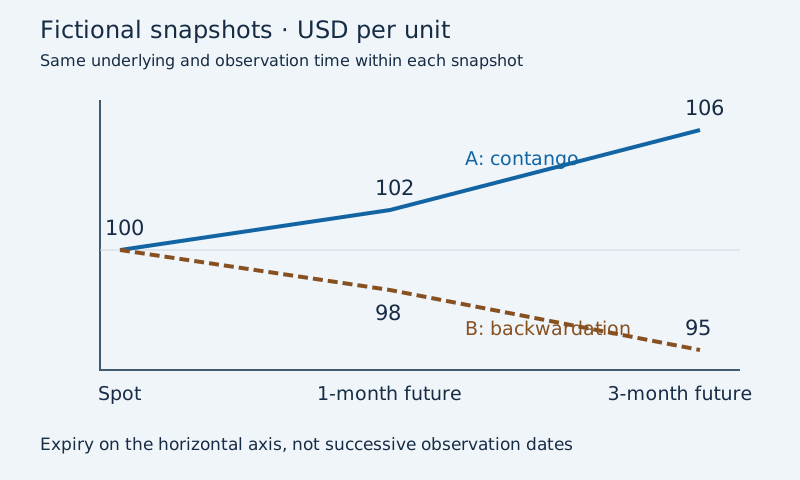
For A, far minus near is 106 − 102 = +4. For B, it is 95 − 98 = −3. A is in contango across the two futures maturities; B is backwardated. Both examples also have the matching futures-versus-spot relationship.
Notice the spread convention: this table uses far minus near. A screen showing near minus far would display −4 for A and +3 for B without changing the underlying market structure. Check the order of subtraction before interpreting a sign.
Why the curve can slope
For physically deliverable, storable commodities, financing, storage and insurance can contribute to a premium for later delivery. Immediate access to inventory can also have value, for example when a manufacturer needs material to keep operating. That benefit is called convenience yield and can help explain backwardation. [1]
These are explanations, not a recipe that produces the same curve in every market. Carry conditions, inventories and the information embedded in less-liquid maturities affect how a curve should be interpreted. A quoted premium is not automatically an executable, cost-free arbitrage. [2]
When a deliverable futures contract nears maturity, convergence concerns the relevant deliverable spot market at that future time. It does not mean that today's spot quote stays fixed while every futures price moves toward it. [1]
A curve is not the same thing as a forecast
Futures prices can contain useful forward-looking information without being unbiased forecasts. Hedging demand and the economics of holding the commodity matter too. Federal Reserve research makes that distinction explicitly: a futures quote need not equal the expected spot price at its expiry. [2]
Suppose today's spot price is $100 and a three-month future is $106. The quote tells you the futures price now. It does not establish that spot will be $106 in three months, or that a buyer will earn $6. The future settlement price is still unknown.
What about normal backwardation?
Normal backwardation is an expectations-based concept: the futures price is below the expected spot price at the contract's maturity. That differs from comparing two observed prices today. The hedging-pressure theory discusses the expected compensation for bearing risk, not a guaranteed payoff. [3]
For a purely hypothetical illustration, let current spot be $100, a future be $106, and an assumed expected spot price at expiry be $110. The future is above current spot but below that expectation. Thus, futures-versus-current-spot contango and normal backwardation can coexist under those assumptions. The $110 is an assumed expectation, not an observed quote or a promise.
Rolling exposure: separate the trade from the later result
A long futures roll closes an earlier contract and opens a later one. Paying the full commodity notional is not how a standard futures position is opened. The gap between contract quotes is therefore not itself a realized loss. Roll yield concerns performance relative to the underlying over time. [4]
Here is a separate fictional illustration using one contract representing 10 units. Ignore fees, bid–ask spreads, financing, collateral interest and other cash flows; assume no disruption to holding the position.
- Close the old contract at $102 per unit. Its realized result depends on its own entry price, which is not specified here.
- Open the new contract at $106 per unit. The $4 difference between contracts does not establish a $40 realized loss on the new position.
- If that new contract later settles at $100, its price P&L is (100 − 106) × 10 = −$60.
- If it instead settles at $110, its price P&L is (110 − 106) × 10 = +$40.
Those are alternative outcomes, not forecasts. Neither is a return on margin, and neither is the total return of a futures fund. A futures-based product need not match a spot-price move; contracts, costs and collateral treatment matter. [4]
Five checks before you use a curve
- Underlying and specification: match the commodity, quality, delivery point and settlement terms. Different benchmarks are not different maturities of one curve.
- Time and quote type: use a synchronized snapshot. Do not mix a live quote with yesterday's settlement or treat an indicative quote as an execution price.
- Expiry and unit: record the actual contract months, currency and price unit. A continuous front-month chart is not a fixed pair of expiries.
- Comparison and sign: say whether you mean futures versus spot or far versus near. Write the spread convention alongside the value.
- Purpose: separate describing today's curve, forecasting a future cash price and measuring a position's return. Each needs different evidence.
For the spot benchmark versus a specified contract distinction, see gold spot versus futures prices.
Frequently asked questions
Does contango mean the commodity price will rise?
No. It describes a specified futures-versus-spot or later-versus-earlier price comparison today. It does not guarantee the direction or level of future spot prices. [1][2]
Is backwardation the same as normal backwardation?
No. Ordinary curve usage compares observable prices. Normal backwardation compares a futures price with an expectation of spot at maturity. That expectation is not directly observable as today's spot quote. [3]
Does rolling in contango automatically lose the price gap?
No. Closing one contract and opening another at a higher quote does not, on its own, realize a loss equal to the gap. You must track the contracts' own entry and exit prices, contract sizes and costs. [4]
Can one curve show both contango and backwardation?
Yes. For example, fictional prices of 100, 104 and 101 across three successive expiries rise and then fall. The first pair is in contango; the second is backwardated. The pair and sign convention should be stated.
Is backwardation a guaranteed opportunity to profit?
No. The curve can move and the underlying can fall. A positive contribution from convergence in a particular scenario does not establish a positive total result, let alone a risk-free trade. [4]
Keep the comparison clear
Start with the exact contracts and observation time. Then identify the curve segment, explain the price difference and keep any forecast separate. You can explore the spot-versus-futures benchmark guide or browse more educational guides.
Sources
- CME Group: What is Contango and Backwardation. Educational definitions, carry, convenience yield and convergence. Checked October 23, 2026.
- Federal Reserve: Revisiting the Forecasting Potential of Futures Prices. Research note dated September 3, 2026; used for the distinction between futures quotes and unbiased forecasts, not for a current commodity call. Checked October 23, 2026.
- Brunetti and Reiffen: Commodity Index Trading and Hedging Costs. Federal Reserve Finance and Economics Discussion Series 2011-57, August 2011; normal-backwardation theory. Checked October 23, 2026.
- Campbell & Company: Deconstructing Futures Returns: The Role of Roll Yield. February 2014 white paper hosted by CME Group, especially pages 3–4; authored by Campbell & Company, not CME. Checked October 23, 2026.
- U.S. Energy Information Administration: Changing contract expiration dates will affect crude oil futures comparisons. January 26, 2016; used for near/far definitions and the need to identify delivery periods, not as a current contract-specification reference. Checked October 23, 2026.
Published by HypaForecast. This guide is educational, not investment advice.
Share this guide