
On this page
- The difference at a glance
- Start with cost, not sale proceeds
- Multiple purchases: which cost belongs to the sale?
- Why two reports can show different P&L
- Lifetime P&L is not the same as this month’s change
- Trading P&L and tax classification are different questions
- Five checks before comparing your figures
- Frequently asked questions
- Keep the questions separate
- Sources
Realized P&L measures a gain or loss assigned to a closed position or the closed part of one. Unrealized P&L measures the gain or loss on what remains open, using a valuation price rather than a completed sale. Neither label, by itself, tells you whether every cost is included.
To compare the two, first match the quantity, acquisition cost, price convention, currency and reporting period. This guide uses simple, fully paid long positions to explain that comparison. It is not a guide to choosing trades, a description of HypaForecast’s account display, or tax advice.
The difference at a glance
| Question | Realized P&L | Unrealized P&L |
|---|---|---|
| What does it describe? | The result assigned to closed units | The valuation gain or loss on open units |
| Which price matters? | The closing transaction price | The report’s current valuation price |
| What cost is compared with it? | The acquisition cost assigned to those closed units | The acquisition cost assigned to the remaining units |
| Can the same position show both? | Yes, after some units have closed | Yes, while other units remain open |
| Are all charges included? | Check the named report | Check the named report |
This is the position-based distinction used in Interactive Brokers’ reporting guide. It should not be read as a definition of every field called “realized” in every product. [1]
Start with cost, not sale proceeds
For the examples here, acquisition cost means quantity multiplied by purchase price, before fees. A provider’s reported cost basis can include commissions or other adjustments, so it may not equal that simple amount.
For a fully paid long position, with one purchase price and all amounts in USD:
- Gross unrealized P&L = open units × (valuation price − purchase price).
- Gross realized P&L = closed units × (sale price − purchase price).
“Gross” means that these examples exclude commissions, financing, currency conversion, taxes and other adjustments. They also assume a unit multiplier of one. Do not copy these formulas into inverse contracts or instruments with different contract multipliers.
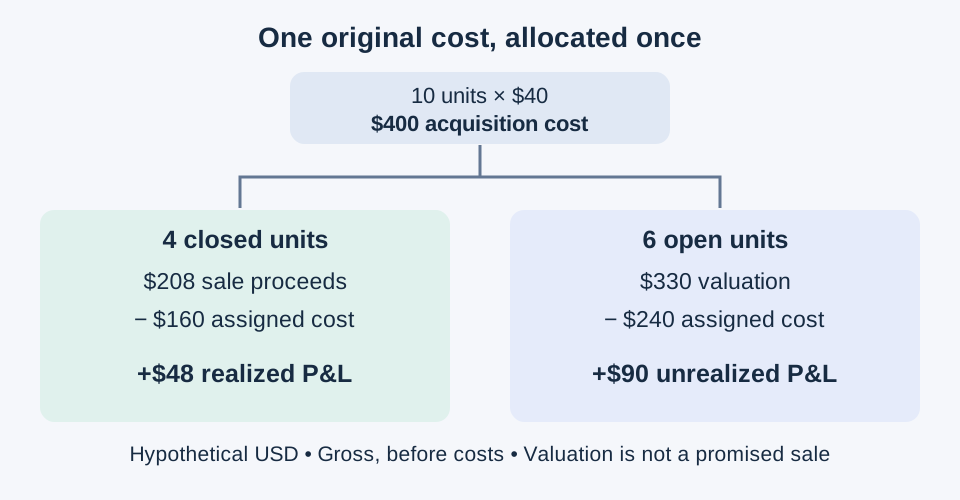
Suppose you buy 10 units at $40. The purchase costs $400. At a valuation price of $55, the open units are worth $550 and gross unrealized P&L is $150. The $550 is a position value, not a $550 profit.
Now suppose four units are sold at $52 and six remain valued at $55:
| Component | Calculation | Amount |
|---|---|---|
| Proceeds from four sold units | 4 × $52 | $208 |
| Acquisition cost assigned to those units | 4 × $40 | $160 |
| Gross realized P&L | $208 − $160 | +$48 |
| Valuation of six remaining units | 6 × $55 | $330 |
| Acquisition cost of those remaining units | 6 × $40 | $240 |
| Gross unrealized P&L | $330 − $240 | +$90 |
| Combined gross result | $48 + $90 | +$138 |
The cross-check is $208 in sale proceeds plus $330 in remaining value, less the original $400 cost: $138. The original $150 unrealized gain is not something to add again. It belonged to the earlier snapshot.
Multiple purchases: which cost belongs to the sale?
A single purchase makes the arithmetic straightforward. Several purchases introduce another question: which opening lot is matched to the closing transaction? A lot is a quantity acquired in a particular purchase.
IBKR’s guide describes several matching methods, including FIFO, LIFO, average cost and specific lot. That list does not mean every method is available or appropriate for every account or tax purpose. [1]
Consider a separate hypothetical example, again without fees or adjustments:
- First purchase: five units at $40, costing $200.
- Second purchase: five units at $60, costing $300.
- Sale: five units at $55, generating $275.
- Remaining units: valued at the same $55 price, totaling $275.
| Illustrative matching choice | Cost assigned to sale | Realized result | Remaining cost | Unrealized result |
|---|---|---|---|---|
| Match the first purchase | $200 | +$75 | $300 | −$25 |
| Match the second purchase | $300 | −$25 | $200 | +$75 |
Both rows give the same combined gross result: $50. The same $500 was spent, the same $275 was received and the remaining units have the same $275 valuation. Only the allocation between realized and unrealized has changed.
That is why a realized-loss figure alone cannot describe this whole position’s performance. Read it alongside the remaining cost and unrealized result. The second row is a mathematical comparison, not a claim that you can select that lot in your account.
Why two reports can show different P&L
Before treating different figures as an error, check what each column includes.
Fees: “realized” does not automatically mean fully net
IBKR documents commissions separately for its mark-to-market performance calculation, while specified lot-based calculations incorporate them into cost basis and proceeds. [1]
OANDA Corporation’s account-statement guide gives a different, specific example: its Trading Summary realized P/L includes applicable currency-conversion costs, but commissions for its raw-pricing-plus-commission model are listed separately rather than deducted from that column. [2]
For a simple reconciliation of our first example, assume $4 of total charges belong to the four sold units and none has already been deducted from the $48 gross result. The result after those charges is $44. If a report has already deducted that same $4, subtracting it again would understate the result. This $4 is an invented educational input, not a provider fee schedule or fee-allocation rule.
Valuation price: the mark needs a definition
Ask whether the open position uses a bid, ask, last trade or another valuation reference, and note its timestamp. OANDA’s named statement uses bid prices for long open positions and ask prices for short ones; its top-of-book valuation also has a stated size assumption. That is an OANDA reporting convention, not a universal one. [2]
In our example, valuing the six remaining units at $54 instead of $55 changes gross unrealized P&L from $90 to $84: 6 × ($54 − $40). The $48 already assigned to the sale is unchanged. A $6 difference between snapshots could therefore come from the valuation input alone.
Currency: compare like with like
A result in an instrument’s quote currency is not automatically the same number in your account’s home currency. OANDA distinguishes the conversion used for displayed position value from the conversion used for unrealized P/L. [2] Check the actual column definition rather than multiplying by an exchange rate copied from a neighboring field.
Lifetime P&L is not the same as this month’s change
Here is a third, independent example. You bought 10 units at $40 before the reporting period. They were valued at $50 at the beginning of the period and $55 at its end. You made no trades and incurred no costs during the period.
- Beginning unrealized P&L since purchase: 10 × ($50 − $40) = $100.
- Ending unrealized P&L since purchase: 10 × ($55 − $40) = $150.
- Change during this period: $150 − $100 = $50.
The $150 answers “how far above acquisition cost is the position now?” The $50 answers “how much did its valuation gain change this period?” Neither calculation is wrong. They answer different questions.
Do not combine a year-to-date realized total with an unrelated day’s unrealized change and call it a complete return. A broader account reconciliation also needs the report’s treatment of cash flows, income and charges. A position P&L subtotal is not automatically an account-performance percentage.
Example: Kalshi report labels. Kalshi’s Documents page reports PnL from closed portions of positions and applied credits or rebates. Its “PnL with fees” deducts opening and closing trading fees; “PnL without fees” excludes those fees. These totals do not include deposits, withdrawals, or changes in the value of open positions. They therefore measure something different from the Predictions portfolio value, which combines cash and the displayed value of positions. Kalshi’s displayed credit balance is already included in cash: adding it again would double-count it. Before comparing figures, check which report, account and period each figure describes, and use the platform’s current definitions. Displayed position values are not guaranteed sale proceeds. See Kalshi’s Trading History and Portfolio: Balances and Positions explanations (checked 31 October 2026).
Trading P&L and tax classification are different questions
The calculations above organize trading results; they do not establish taxable income, a tax rate or the timing of a tax obligation. Even where terminology overlaps, tax analysis uses the applicable jurisdiction’s rules and the asset’s classification.
For example, U.S. IRS guidance on capital assets compares sale proceeds with adjusted basis and distinguishes categories of capital gains and losses. That is not permission to classify every trading product, including a prediction-market contract, as a capital asset. [3] Do not use an app’s “realized” or “unrealized” label as a substitute for the relevant tax guidance.
Five checks before comparing your figures
- Identify the instrument, long or short direction, units and any contract multiplier.
- Find the acquisition cost assigned to closed units and to remaining units. Check the matching method.
- Record the valuation price, timestamp and reporting currency.
- Identify which charges are included and which are separate. Count each charge only once.
- Match the reporting periods and distinguish an ending balance from a change during the period.
If the figures still do not reconcile, use the transaction and statement definitions to locate the difference. Do not alter cost basis just to make a total fit.
Frequently asked questions
Can I have realized profit and an unrealized loss at the same time?
Yes. In the two-purchase example, matching the first lot produces $75 of gross realized profit and leaves a $25 gross unrealized loss. The combined result is $50 at the stated valuation, before costs.
Is the full amount I receive from a sale my realized profit?
No. In the first example, $208 of proceeds includes $160 of acquisition cost. The gross profit is the remaining $48, before any applicable charges or adjustments.
Does a realized P&L figure always include fees?
No. Read the report definition. The IBKR and OANDA examples above treat commissions differently in their named calculations. A charge shown elsewhere must not be ignored or counted twice. [1][2]
Why does my unrealized P&L differ from the price change on a chart?
Compare the chart’s price with the report’s valuation reference and timestamp. Then check your actual purchase prices, quantity, cost adjustments and currency conversion. In the hypothetical six-unit example, a $1 difference in valuation price changes gross unrealized P&L by $6.
Does “unrealized” mean I can ignore the loss?
No. In the lot example, the remaining position is valued below its assigned acquisition cost. Not closing it does not erase that difference or establish that its value will recover. The label describes how the result is measured, not whether holding or selling is the better choice.
Keep the questions separate
Use realized P&L to understand the result assigned to closed units, and unrealized P&L to understand the valuation of what remains open relative to its assigned cost. Reconcile the two using one consistent set of quantities, prices, costs and dates.
For the separate question of how prediction-market positions are entered and exited, read how to trade prediction markets. For more educational comparisons, browse the article library.
Sources
- Interactive Brokers: Realized & Unrealized Performance Summary in Base. Page updated March 20, 2025; checked October 23, 2026. Used for the position distinction, lot matching and report-specific commission treatment.
- OANDA Corporation: Account statement. Checked October 23, 2026; publication date not stated. The page specifies which statement generations its definitions apply to. Used only for the named statement’s valuation, currency and commission conventions.
- Internal Revenue Service: Topic no. 409, Capital gains and losses. Checked October 23, 2026; publication date not established here. U.S. capital-asset guidance cited only to distinguish tax classification from trading P&L, not to classify prediction contracts.
All numeric scenarios are hypothetical and independently calculated. They are not quotes, past returns or forecasts.
Share this guide